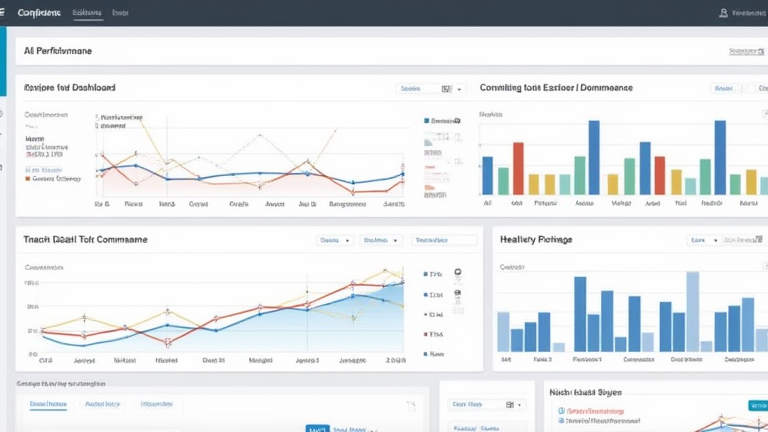
TL;DR: BigCommerce Sales Data Dashboards provide merchants with real-time visibility into sales performance, customer behavior, and inventory levels through customizable, data-driven interfaces. These tools empower businesses to make informed strategic decisions, optimize marketing spend, and drive sustainable revenue growth by leveraging integrated analytics and third-party reporting capabilities.
The Evolution of E-Commerce Intelligence
In the rapidly expanding landscape of digital commerce, data is no longer just a byproduct of transactions; it is the primary engine for strategic decision-making. BigCommerce, a leading B2B SaaS e-commerce platform, has significantly upgraded its native analytics capabilities to meet the demands of modern merchants who require granular insights without the need for extensive manual data wrangling. The latest developments in BigCommerce Sales Data Dashboards represent a shift from static reporting to dynamic, interactive intelligence that adapts to real-time market fluctuations.
Key Features and Specifications
The updated dashboards are built on a robust architecture that allows for seamless integration with major business intelligence tools such as Tableau, Power BI, and Looker. This interoperability ensures that merchants are not locked into a single ecosystem but can leverage their existing tech stack for deeper analysis. A standout feature is the enhanced customization of widgets, which allows users to drag and drop specific metrics such as Average Order Value (AOV), Customer Lifetime Value (CLV), and conversion rates directly onto their primary view.
Furthermore, the platform now offers advanced segmentation capabilities. Merchants can slice data by geographic region, device type, payment method, or customer cohort with unprecedented ease. This level of granularity enables businesses to identify high-value segments and tailor their marketing efforts accordingly. The dashboard also includes automated anomaly detection, which alerts users to sudden drops or spikes in sales volume, allowing for immediate troubleshooting of potential technical or supply chain issues.
Industry Impact and Strategic Advantages
The impact of these enhanced dashboards on the e-commerce industry is profound. By democratizing access to complex data analysis, BigCommerce is leveling the playing field for small and medium-sized enterprises (SMEs) that previously lacked the resources for dedicated data science teams. The ability to track performance in real-time means that businesses can pivot quickly in response to changing consumer behaviors, seasonal trends, or competitive pressures.
For enterprise-level clients, the integration capabilities facilitate unified reporting across multiple sales channels, including social commerce and marketplaces. This holistic view is crucial for maintaining brand consistency and operational efficiency across diverse platforms. Moreover, the emphasis on user experience in the dashboard design reduces the learning curve, enabling non-technical staff to generate valuable insights independently. This shift not only improves operational agility but also fosters a data-driven culture within organizations, where decisions are backed by evidence rather than intuition.
As the e-commerce sector continues to mature, the ability to harness data effectively will separate industry leaders from laggards. BigCommerce’s commitment to providing powerful, accessible analytics tools positions its merchants to thrive in an increasingly competitive global market. By focusing on actionable insights rather than just raw data, these dashboards serve as a critical compass for navigating the complexities of modern digital retail.
FAQ
Q: Can I integrate BigCommerce dashboards with external BI tools?
A: Yes, BigCommerce offers robust API connectivity and native integrations with popular business intelligence platforms like Tableau, Power BI, and Looker for advanced analysis.
If you want to dig deeper, check out our guide on Why the Lemon Squeezy Application Process Is Insane.
Q: Are these dashboards suitable for small business owners?
A: Absolutely. The user-friendly interface and pre-built widgets allow merchants with limited technical expertise to track key performance indicators effectively without needing a data scientist.
Q: How often is the sales data updated in the dashboard?
A: The dashboard provides near real-time updates on sales metrics, ensuring that merchants have access to the most current information regarding orders, inventory, and customer activity.